 Edwin
Answers for the Board Meeting, Already Drawn.
Every module shares one database, so the numbers agree. Enrollment matches billing, and billing matches admissions.
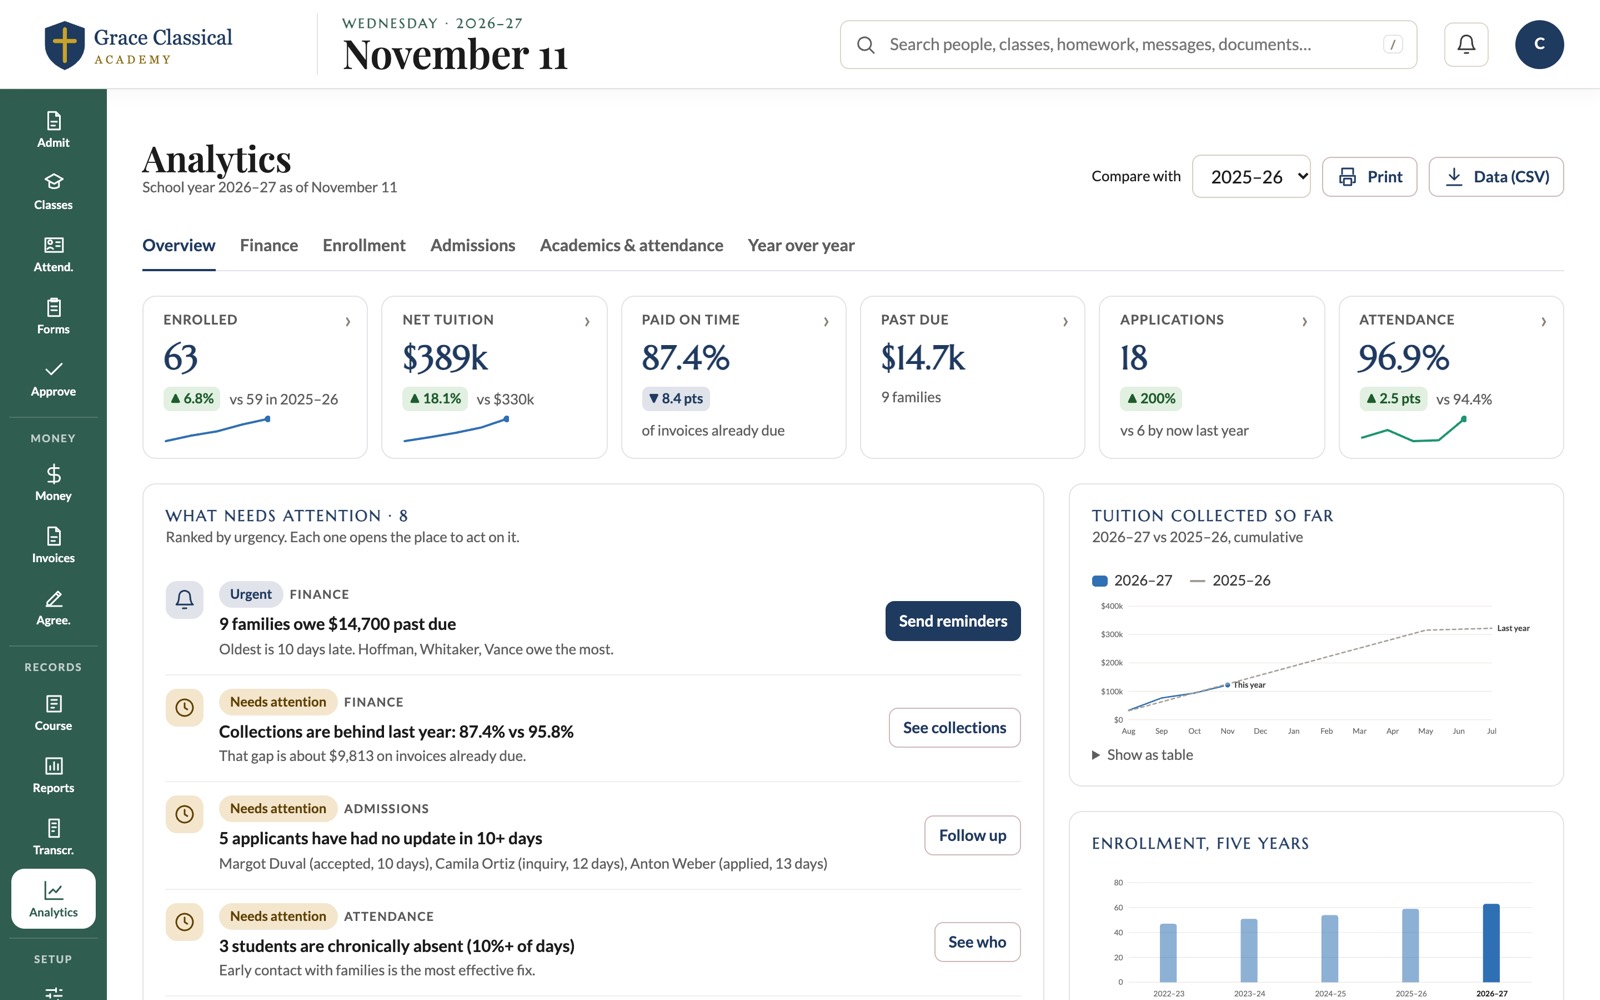
Analytics overview, with what needs attention ranked first.
Analytics, in Detail.
What Needs Attention
A ranked list of what to act on, with the numbers behind it.
Finance
Collections pace against last year, aging, payment mix and projections.
Enrollment
Five-year bands, seats by grade and retention.
Admissions
Funnel by stage, conversion and time in stage.
Academics & Attendance
Averages, missing work and chronic absence.
Year Over Year
Compare school years. Every chart has a table and a CSV export.
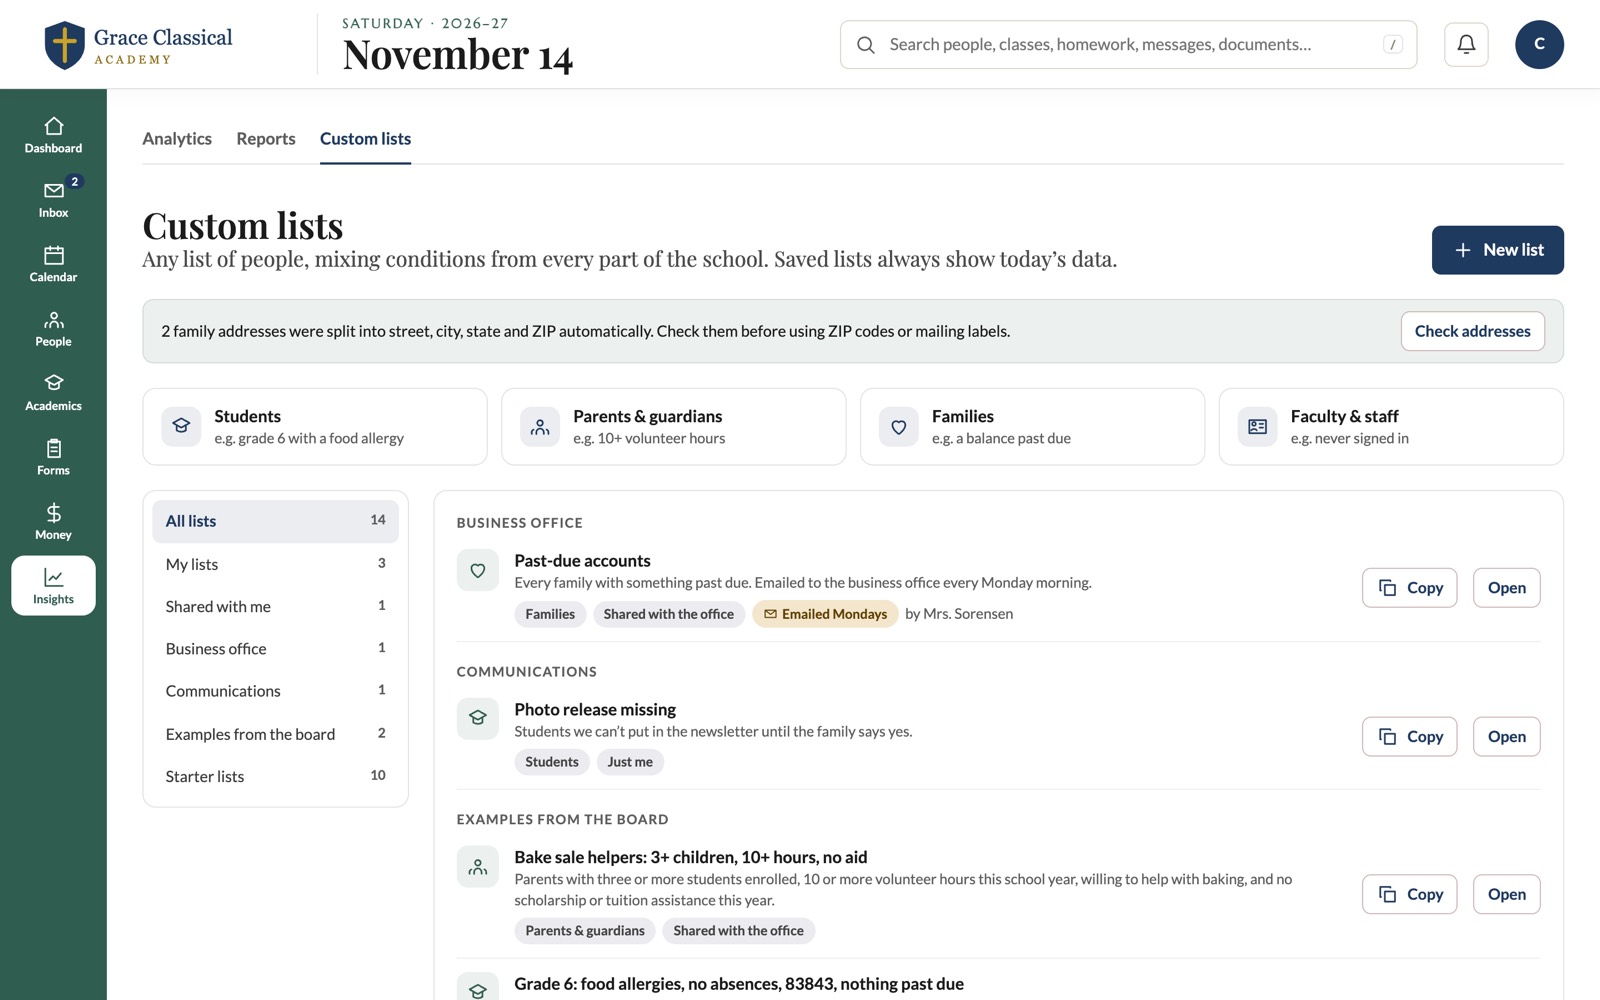
Custom Lists
Mix conditions from every part of the school, such as parents with three children enrolled and ten volunteer hours.
Saved and Scheduled
Save lists in folders, share them with colleagues and have them emailed on a schedule.
Act on a List
Download a CSV, print it or mailing labels, or message everyone on it.
Replaces: spreadsheetsBI exports
Any List the Board Asks for, in a Minute.
Pick students, parents, families or staff, then add conditions from grades, attendance, billing, volunteering and your own custom fields. Saved lists always show today's data.
- Conditions from every area
- Shared and scheduled lists
- Message these people
See It with Your School's Data.
Tell us about your school and we'll walk you through analytics and the rest of Edwin on a short video call.